Starting from Analytics to Reports and Live, we are exploring the important sections of Shopify Analytics so you can get key insights into your e-commerce data.
Discover new analytics tools faster, more flexible and more intuitively designed to analyze data efficiently maximize the focus on the optimization of business.
Shopify analytics is up to a great extent capable of empowering you with better, faster, and more intuitive data insights. From now, your Shopify data will be available in real-time and in the upgraded visualizations, deleting the effort needed to make informed business decisions.
Instant Access: Get real-time reports and insights so you can act quickly, without waiting on data refresh.
Flexibility: you can give reports at the level needed and understand your business further.
User-Friendly Design: The new interface is intuitive and easy to navigate so you can analyze your data easily even for those not data experts.
Now, you can:
Personalize Your Dashboard: Display the most important metrics tailored to your needs.
Leverage Pre-Built Reports: Access detailed reports designed to answer common business questions.
Edit and Enhance: Modify these reports by adding any combination of metrics and dimensions.
Build Custom Reports: Create new reports from scratch, giving you complete control over your data analysis.
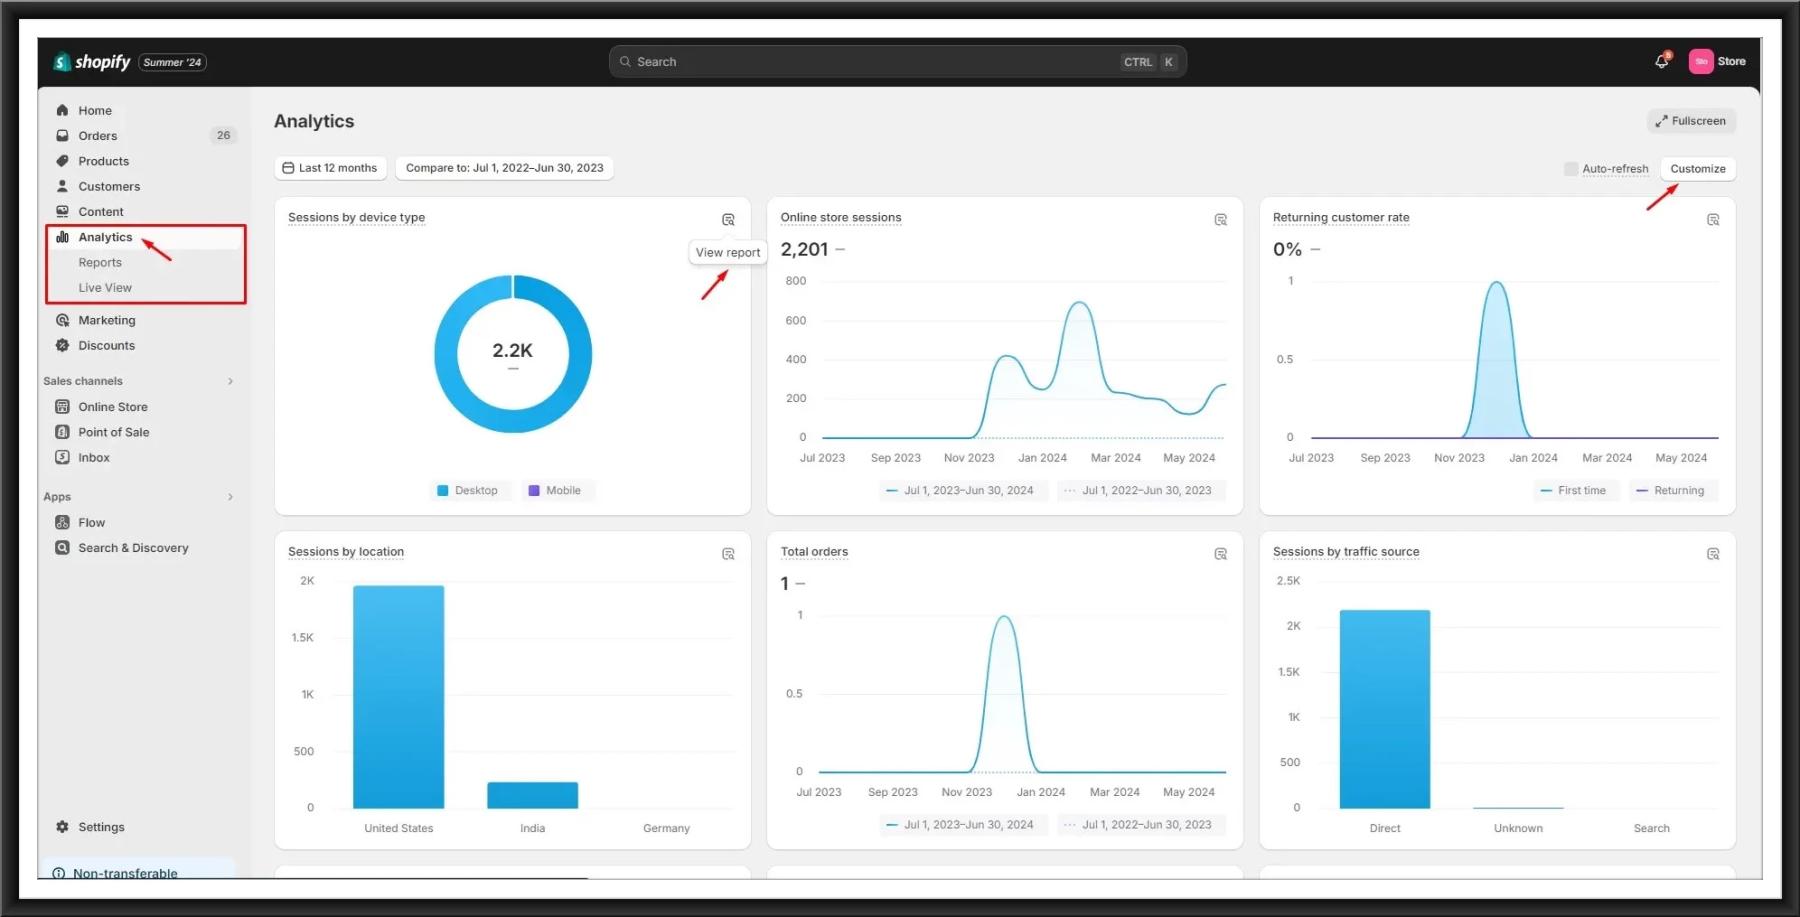
In Shopify’s latest analytics update for Summer ’24, users now have enhanced customization options that provide flexibility and ease of use when analyzing store data.
In the below image, you can see the customization option in the new analytics, which can be easily toggled to ‘Drag & Drop Functionality’ and ‘Resize’.
Real-Time Data Updates :
Timeliness: The analytics interface supports real-time data updates, ensuring that changes in performance metrics and key indicators are reflected immediately.
Monitoring: This feature is invaluable for monitoring live campaigns, tracking real-time sales trends, and promptly assessing the impact of operational adjustments or marketing initiatives.
Drag and Drop Functionality :
Functionality: Users can intuitively rearrange elements within the analytics interface by simply clicking and dragging items such as metrics cards, widgets, and data points.
Purpose: This feature allows for easy organization of dashboard layouts and report structures, enabling users to prioritize and highlight the most relevant data points for their analysis.
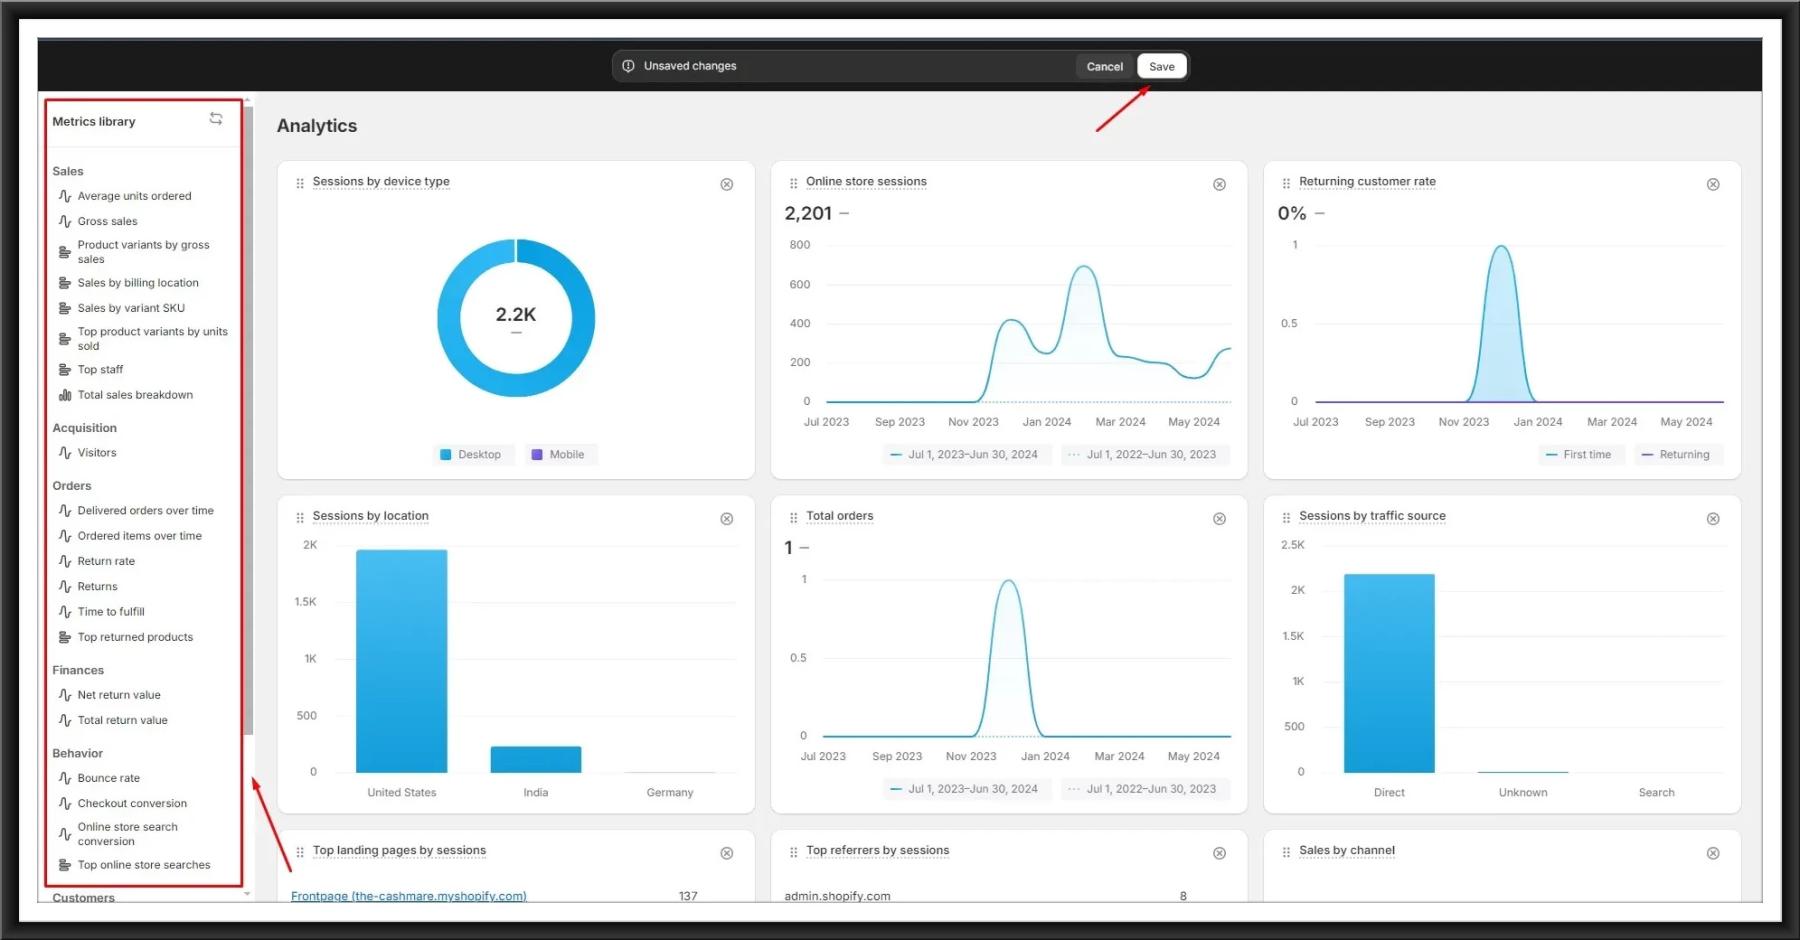
Each metric card’s visibility can be controlled based on its relevance and importance to ongoing analysis.
Reports are sets of your store’s data displayed in both a graph and table format and are organized into categories, based on the subject of the report.
You can create a report from scratch. If you have a lot to include, you can create an exploration from the Reports page, allowing you to customize the report exactly how you want it and saving you time that would be spent searching for a good report.
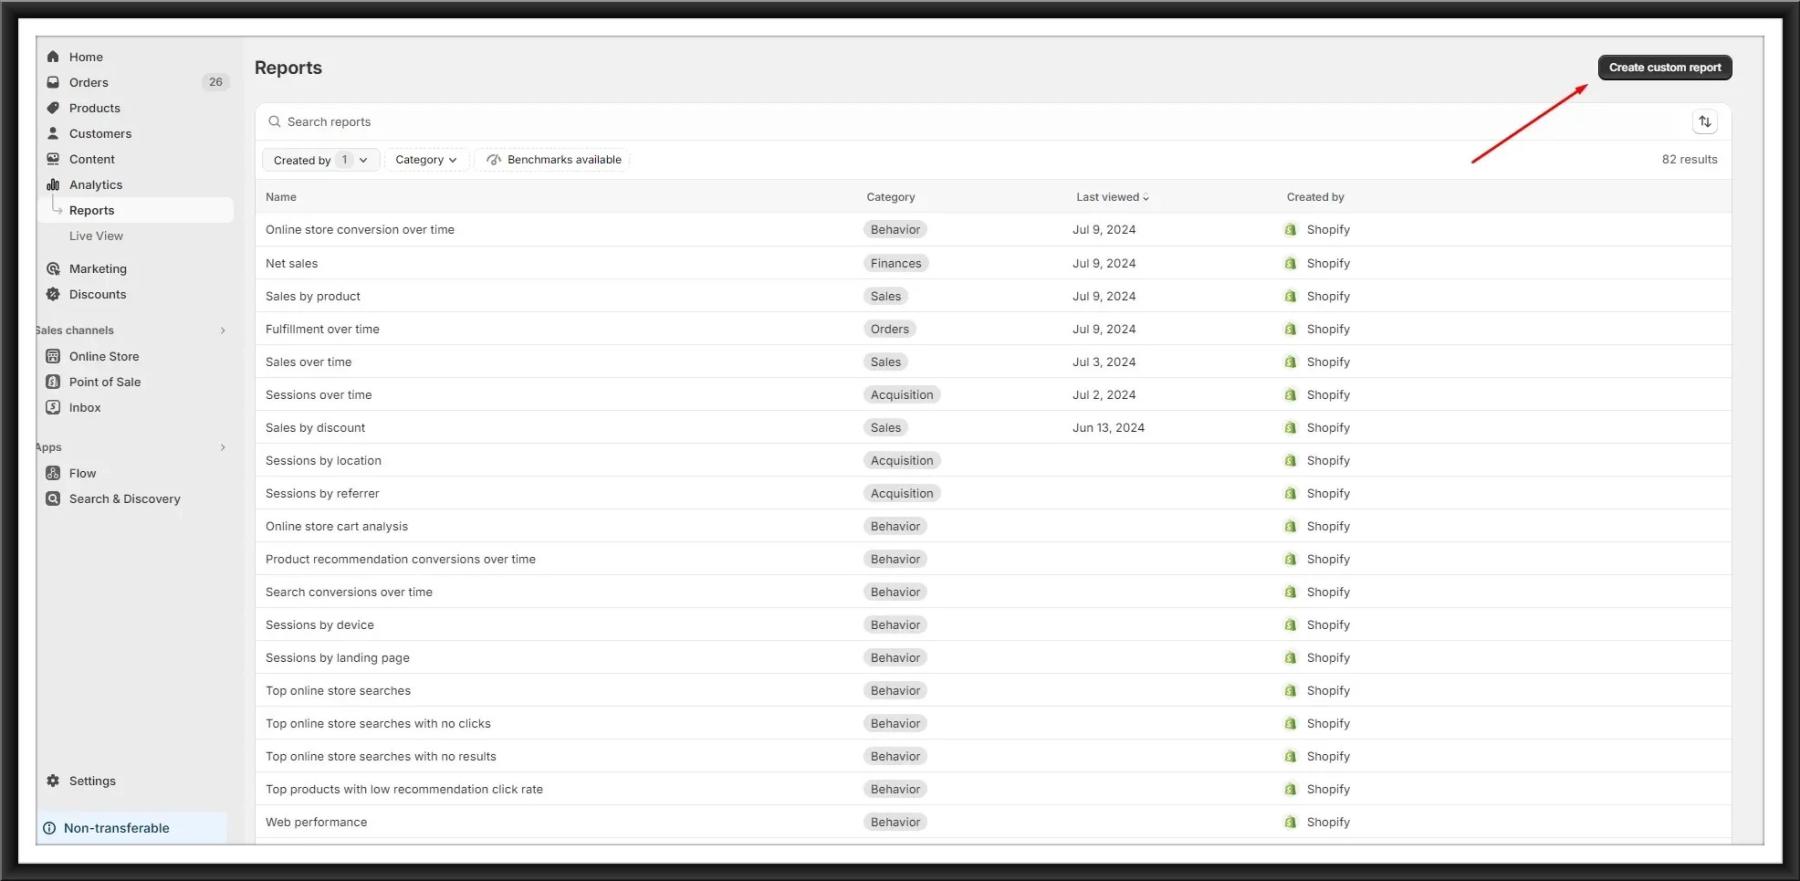
Reports typically show metrics like total sales, average order value, conversion rate, and customer retention rate.

