1. Benchmarks in Shopify Analytics
Shopify Benchmarks are a powerful way to see how your store stacks up against similar businesses. Here’s how you can start using them to your advantage:
Accessing Benchmarks
To find benchmarks:
-
Go to your Shopify admin.
-
Navigate to Analytics > Reports.
-
Open a report that includes benchmark comparisons.
-
In the report configuration panel, click on the Comparison menu and select Benchmarks.
This will allow you to see your store’s performance compared to similar stores.
Eligibility Requirements
Not all stores will see benchmark data. Your store must meet the following criteria:
-
You’ve sold at least one product in the last 30 days, and that product has a category assigned.
-
There are enough similar stores in your benchmark group to ensure meaningful comparisons.
-
Benchmarks are currently only available for Meta (Facebook/Instagram) advertising campaigns.
Understanding the Data
Benchmarks provide a range of values that show how stores like yours are performing:
-
Median (middle value)
-
25th percentile (lower-performing stores)
-
75th percentile (top-performing stores)
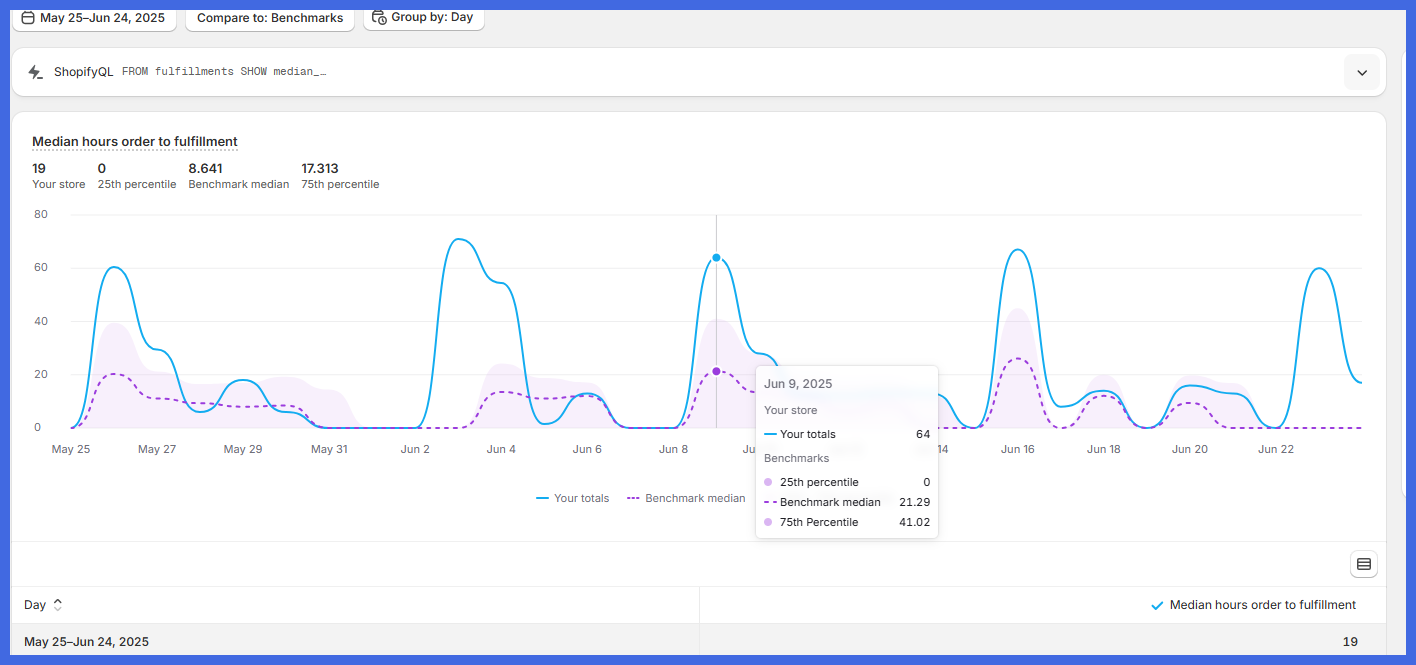
-
Your store (blue line) – This is your actual data (how long you’re taking).
-
Benchmark Median (purple dotted line) – This is the middle value across all similar stores.
-
Shaded area – This covers the range from the 25th percentile (bottom performers) to the 75th percentile (top performers).
2. Cohort Analytics
Cohort analytics is a way to group your customers based on when they first made a purchase and then track how they behave over time — like how often they come back, how much they spend, or when they drop off.
How to Access in Shopify:
-
Go to your Shopify Admin
-
Click Analytics > Reports
-
Look for Customer Cohort Analysis
Imagine you’re selling clothes on Shopify. You want to know:
-
How many new customers in January came back in February, March, and April?
-
Which month’s customers are the most loyal or spend the most?
Cohort, All customers who placed their first order in the same month.
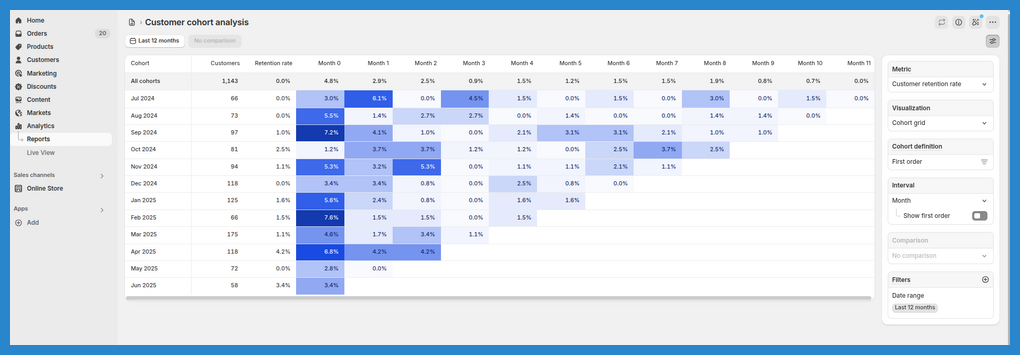
Example Breakdown (Feb 2025 Cohort):
-
66 customers placed their first order in Feb 2025
-
In Month 0, 7.6% of them came back and ordered again in the same month
-
In Month 1, 1.5% of them came back
-
In Month 2, 1.5% came back again
-
In Month 3, 0.0% returned
-
In Month 4, 1.6% returned

